How gradient and categories are measured and what they can (and can’t) tell you about climbs
Put down your protractor and freshen up on some basic math concepts

As a cyclist, you know that a four per cent climb isn’t that bad (unless it’s a long one) and you shudder when you hear that the maximum gradient on Alpe D’Huez is 13 per cent. Gradient is used to categorize climbs in races and is the preferred metric when discussing local ascents, but where do these numbers come from, and how reliable are they? The basic answer is straightforward, but gets more complex when you dive into the specifics.

The basics
Gradient is a measure of a road’s steepness—the magnitude of its incline or slope as compared to the horizontal. Most often presented as a percentage, the gradient of a climb will normally fall somewhere between 3-15 per cent.
To measure the gradient of a climb, you need at least two pieces of information: The horizontal distance of the climb and the increase in elevation or height when moving from the bottom to the peak.
Calculations of road steepness are straightforward when you imagine a theoretical cross-section of the climb. Do the words rise over run trigger any old memories of high school chalkboards? In this case, the run is the horizontal distance and the rise is the elevation increase. In order to get the ‘slope’, the ‘rise’ is divided by the ‘run’. Whole numbers tend to look nicer than decimals, so the result is multiplied by 100 and expressed as a percentage.
For example, a 6 km climb (6,000 m) that increased by 240 vertical metres would have a 4 per cent grade:
(240/6000) x 100 = 4
Getting specific
The basics of calculating gradients are straightforward, but when applying them in the real world many other factors come into play.
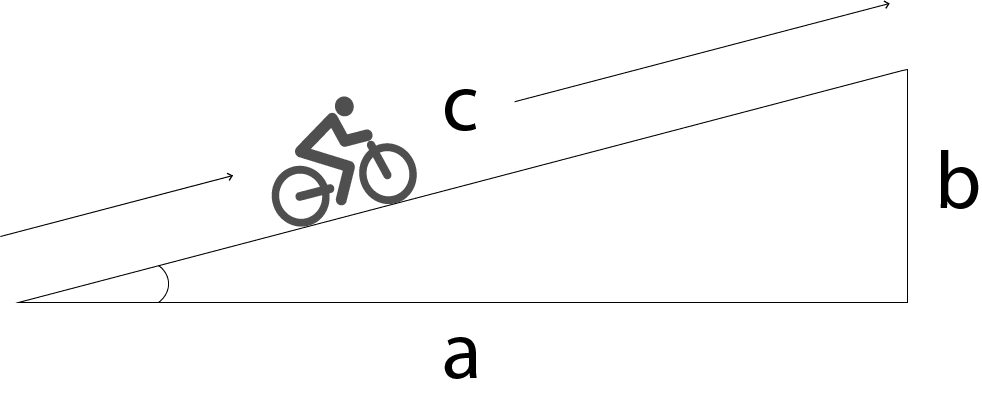
Firstly, the distance from the bottom to the top of the hill (c) is not actually the same as the run (a). To get a more accurate gradient, we’ll have to dive deeper into the pits of your highschool math memory and use the pythagorean theorem. As a² + b² = c², you can use the distance from the bottom to the top of the climb (c) and the total elevation gain (b), to solve for actual distance of the climb (a). The difference between a and c is normally quite small, as the angle of inclination of the triangle is very rarely more than 10 degrees, but if you’re calculating gradient by hand and enjoy accuracy this method will increase precision.
But why would you calculate gradient yourself when you can see it on Google Maps? Surprisingly Google’s all-seeing satellites are not as accurate as they could be. In 2018 Omar El Masri, a UBC civil engineer wrote his entire masters thesis on road grade information for bicycle travel analysis. Using Vancouver as an example, he found that methods used by popular routing applications such as Google Maps, Strava and RideWithGPS, append the GPS data collected with elevation data from the coarse elevation datasets. The resulting gradient estimates, he says, can be inaccurate and inadequate, particularly on climbs without a single dominant grade.
To complicate things further, no climbs in the real world follow a perfectly straight line. Variability in the gradient can massively impact the difficulty of a climb. A four per cent 7 km climb will feel very different if the climb is steady versus if it pitches from three per cent to 12 per cent in the middle.
Categorizing climbs
The Tour de France introduced its mountain classification for the first time in 1933 in which riders were awarded points for arriving first over a climb. As time went on it became clear that not all climbs were created equally and in 1947 they were divided into two types, category one (10 points for the first cyclist) and the slightly less difficult category two (5 points to the first cyclist).
As the Tour grew, categories three and four were added for easier climbs, and, eventually, ‘Hors catégorie’ a climb that is “beyond categorization”. ‘Hors catégorie’ or ‘HC’ was originally used to categorize the steepest mountain roads where cars were not expected to be able to pass.
Although race organizers take into account distance and gradient, categorization is somewhat subjective. Variables such as pitches in the gradient, the length of a stage, the position of the stage within the Tour and the position of a climb within the stage are all considered when classifying a climb.
Strava, on the other hand, uses a hard metrics to classify climbs. Segments with a gradient of more than three percent are considered ‘climbs’. They will be classified as categorized climbs if their total length in meters multiplied by the grade of the climb (in per cent) is equal to 8,000 or more.
Strava’s categorizations:
Cat 4: +8,000 (e.g. 2 km at four per cent)
Cat 3: +16,000
Cat 2: +32,000
Cat 1: +64,000
HC: +80,000
How useful is gradient?
While gradient is a useful metric for estimating the difficulty of a climb, it’s only one part of a much bigger picture. If you’re exploring local routes, talk to others who have ridden them and get their opinions on the best climbs for some solid type two fun.