Cyclist creates mesmerizing completed map of London from five years of ride data
The rider covers every road in the city
The subreddit /r/DataIsBeautiful is full of visual representations of data. Users posts graphs, maps and charts with the goal of conveying information in an elegant and effective way.
/r/DataIsBeautiful features entertaining statistics,
more serious posts,
WW2 killed 27 million Russians. Every 25 years you see an echo of this loss of population in the form of a lower birth rate. from r/dataisbeautiful

and educational visualizations.
[OC] Hours of daylight as a function of day of the year and latitude from r/dataisbeautiful
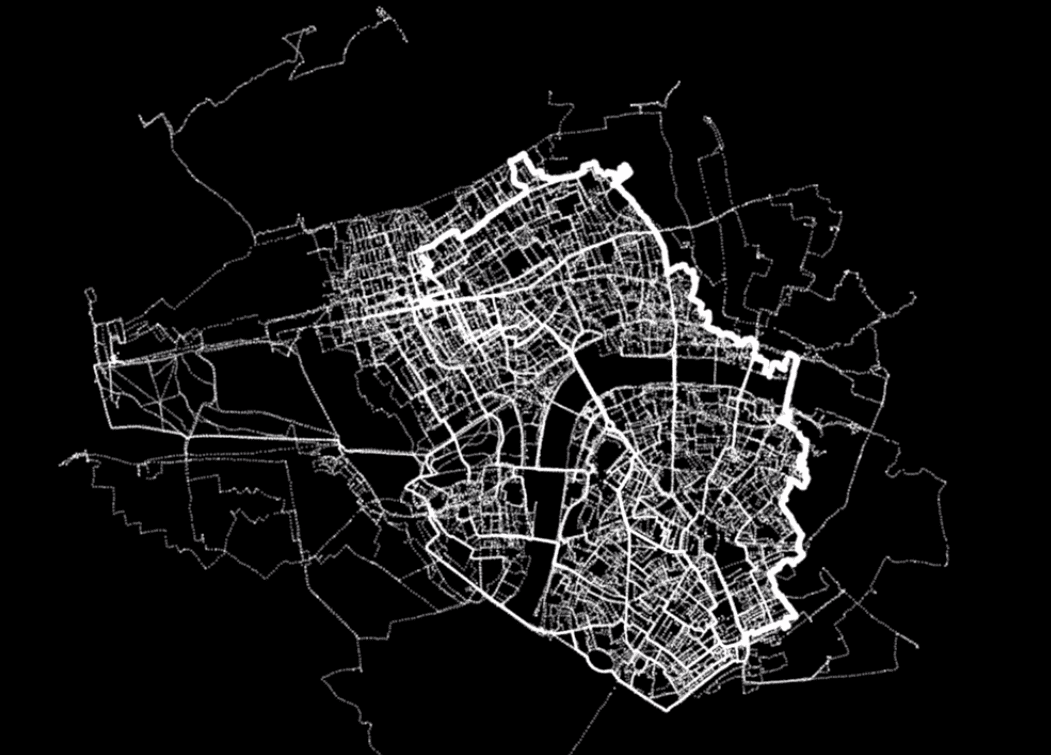
A cycling map of London
Cyclist and Reddit user Davis Vilums posted the result of five years of work in /r/dataisbeautiful and the product is mesmerizing. Bored with his daily commute, the cyclist started riding different roads to work every day. Eventually he bought a map of London and started colouring in the streets he had ridden. Vilums became obsessed with filling in the map and completed his goal of riding every road in London in 2019. He recently put together a chronological map of his routes, which he recorded daily on and app called Endomondo.
RELATED: Strava’s new heat map uses 27 billion km of data
Last week, Vilums posted a video of his routes layered on top of one another on a black background, slowly revealing London’s street grid.
[OC] This is how London’s street grid reveals using only my cycling journeys over the last 5 years Bumblebee style. from r/dataisbeautiful
When asked in the comments how he made the video, Vilums explained his process simply. First he exported his rides to GPX and converted and merged them in CSV files. He then uploaded them to QGIS, a Geographical Information System that is open source software and can be used for data visualization. Things get a bit more complicated at this point, but the cyclist linked a medium article that breaks down using QGIS to animate routes.
On his website, he concludes that the exercise was an enjoyable waste of time. “I liked every bit of it,” he says, “planning, executing and then colouring in the streets and paths where my route took place. I found it a great way how to discover new areas in London and familiarize all the boroughs of central London. This journey for me made every corner of central London feel like home.”