Strava ‘Your Year in Sport’ and other ways to visualize your 2019 cycling data
Reflect on the last 12 months with these facts and figures

Coming up to the new year, it’s time to contemplate and review 2019. For cyclists, much of this year-end reflection will be about the sport in which they invest so much time. To hell you mull over your cycling data, Strava has released their ‘Your Year in Sport’ feature for 2019, a great tool for any athlete interested in what they’ve accomplished this year. The summary explores your activities throughout the year, focusing on time, elevation, distance and days active. If you’re a multi-sport athlete, it takes into account the hours you spent doing all activities, not just your primary sport.

If the data in Strava’s year end summary is something that appeals to you, check out these Strava-approved data visualization add-ons.
Velo Viewer

Velo Viewer goes deeper into your data than you ever thought you would go. The application has tons of features, some obvious others less so. Get yourself lost by clicking around for a while then check out the blog/about page for a better summary of how to use Velo Viewer and some of the less obvious features it provides.
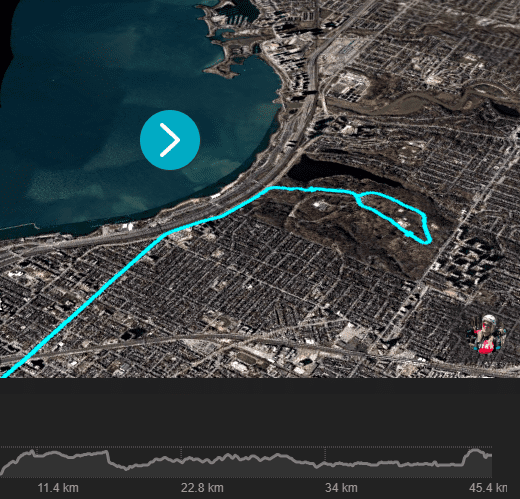
Loopie Route
Visualize your favorite ride with a clean and crisp background. This app is particularly good at emphasizing elevation so choose a climb with a good gradient for maximum impact.
Storyteller
Tell the story of any of your rides, by creating an animated map including photos and the location where they were taken.
Cartorion
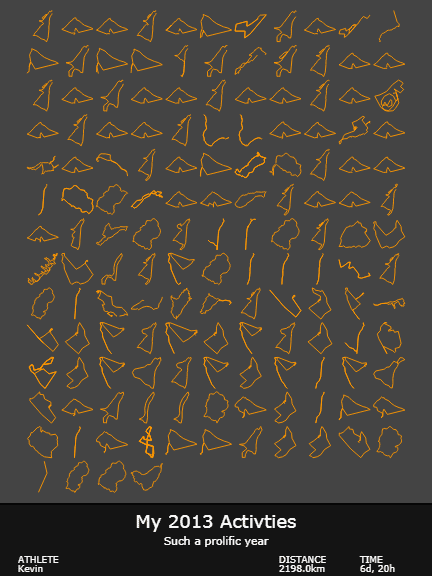
This application takes your Strava data and creates personalized posters. The grid map option creates an artistic poster out of the shape of the routes you’ve ridden throughout the year. The calendar poster displays the days you were active in 2019 as cubes.
Keep Running

Keep Running visualizes all the routes you’ve ridden throughout the year, overlaid on each other with a clean monotone background.