Strava’s Year in Sport offers some fascinating insights on 2020
Statistics from the training app provide a lens into global athletic behaviour during the pandemic
 Photo by:
strava
Photo by:
strava
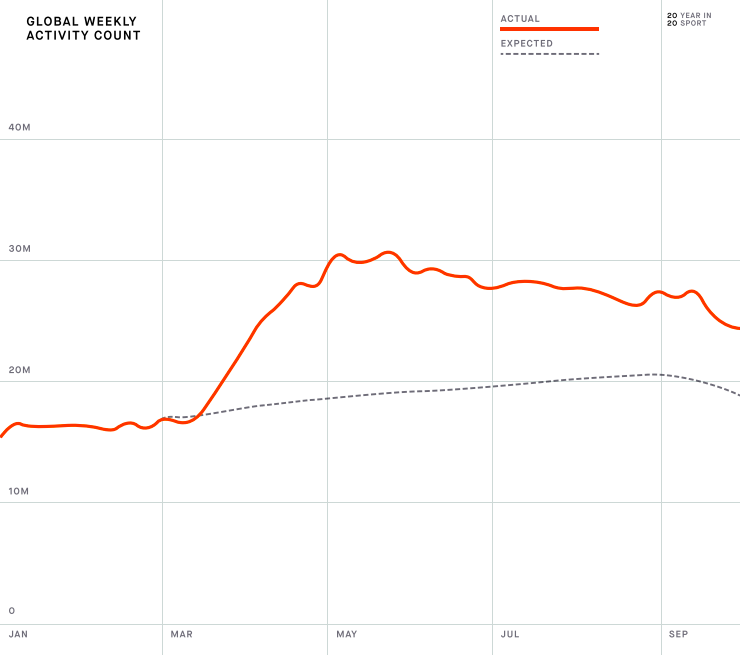
Strava has access to a massive amount of data. With information derived from 73 million athletes and 21.5 million uploads per week, the training app was able to paint a very interesting picture from a unique year.
Big numbers
As Strava continues to grow, the numbers they publish are always surprisingly large. This year cyclists rode 13.0 billion kilometres and climbed 121.9 billion metres.
According to the company, the pandemic created an exercise boom at a global level. The unprecedented rise in activity far surpassed Strava’s predictions for the year.
Changing behaviour
The shift in behaviour varied drastically from country to country during the first wave. When Spain and Italy went into hard lockdown, outdoor activities dropped dramatically by 67 per cent and 64 per cent respectively. When the lockdowns were slightly lifted in May, uploads shot back up, surpassing the predicted activity levels for the month by 30 per cent in Italy and 51 per cent in Spain.
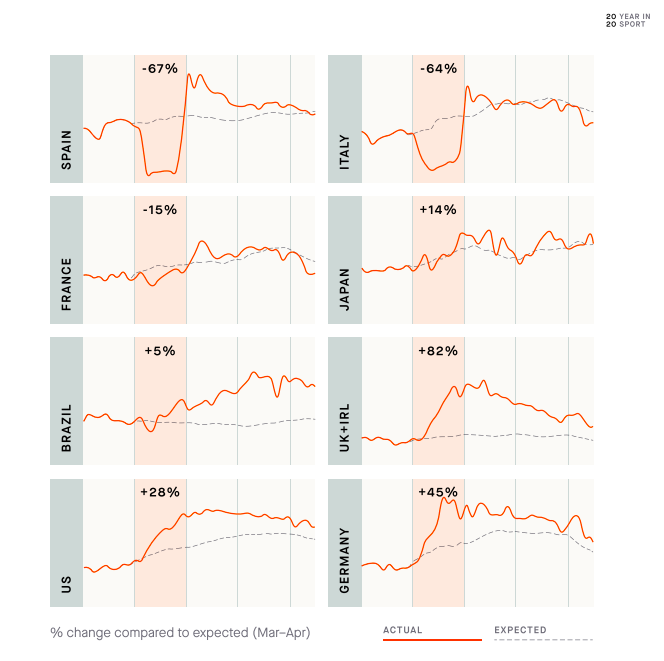
In France, where activity was restricted to one kilometre from home, cycling took a hit, but athletes adapted and running increased in popularity.
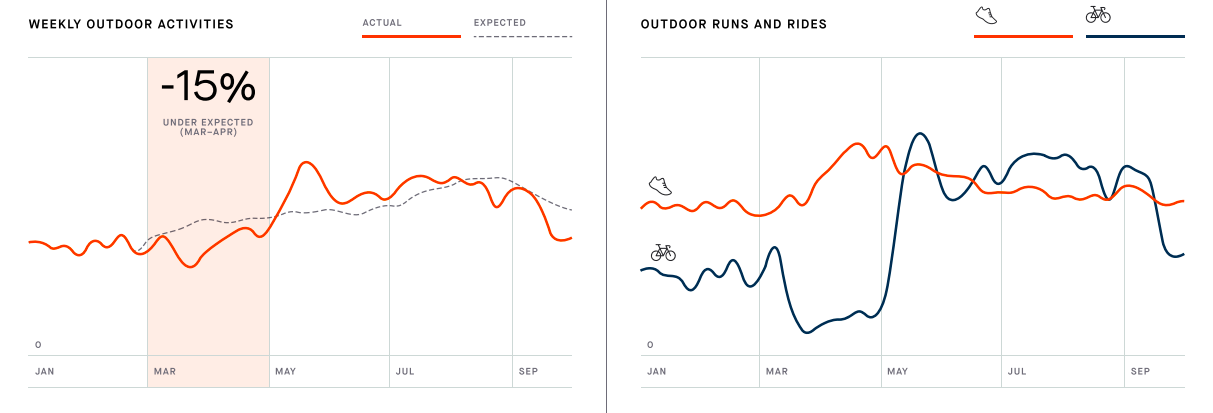
In 2020 many athletes (not just French cyclists) branched out and got creative with exercise. This year, 8.5 per cent of cyclists uploaded their first walk—the activity was uploaded three times more this year than in 2019. 5.6 per cent of cyclists took not-biking even further and went for their first recorded outdoor run.

Many people also got more into cycling. From April to June this year, athletes uploaded 1.8 times more outdoor bike rides than in 2019. Indoor rides grew at almost the same rate, increasing by 1.7 times. In a regular year spring and summer aren’t typical indoor riding times, so the increase really demonstrates the growth in trainer popularity.
Average athletes
In 2020 the average ride was 25.4 kilometres long and the average ride time was 01:15:49. Overall, athletes’ yearly moving time increased by 14.7 per cent and globally. Women aged 18-29 saw the biggest difference in median number of activities per athlete between April and September, increasing by 45.2 per cent.
In 2020 athletes stayed occupied by creating and joining new clubs, taking up Strava challenges and participating in solo events such as Everesting. According to Strava’s Everesting data, it took women an average of 17h 13m 48s and men 16h 47m 40s to climb 8,849m.
Though there wasn’t much racing, the competition this year was still tough—compared to 2019, 36 per cent more QOMs and 32 per cent more KOMs changed owners. The competition was also friendly. There’s a 27 per cent chance that the top two athletes on any KOM or QOM leaderboard are already following each other.
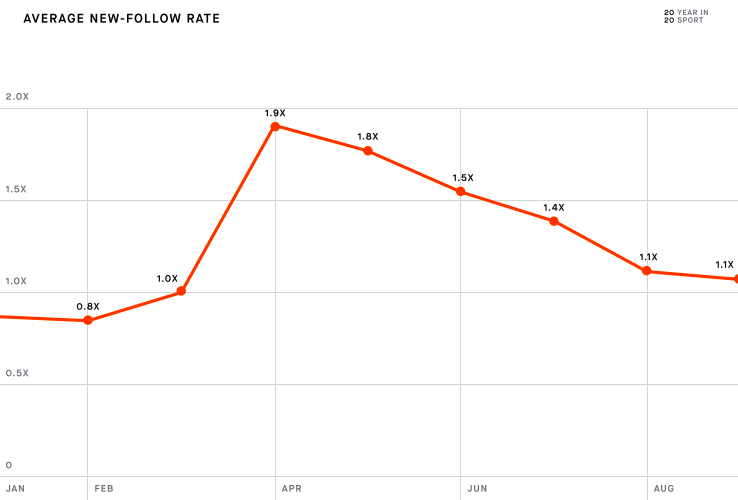
Some of those frenemy follows may be from this year. Compared to April 2019, the average athlete followed almost two times as many people in April 2020. Though we couldn’t ride together, the desire for connection was still there.